Feature Daily
Genius or Dope? Chalmers faces the ultimate housing test

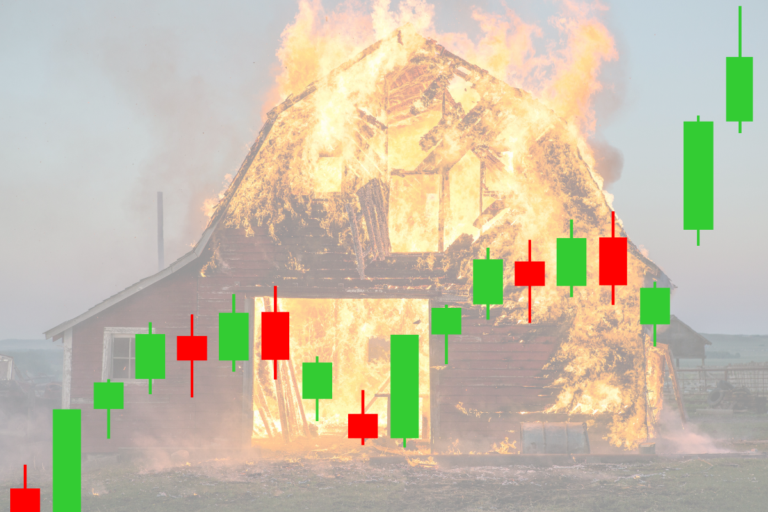
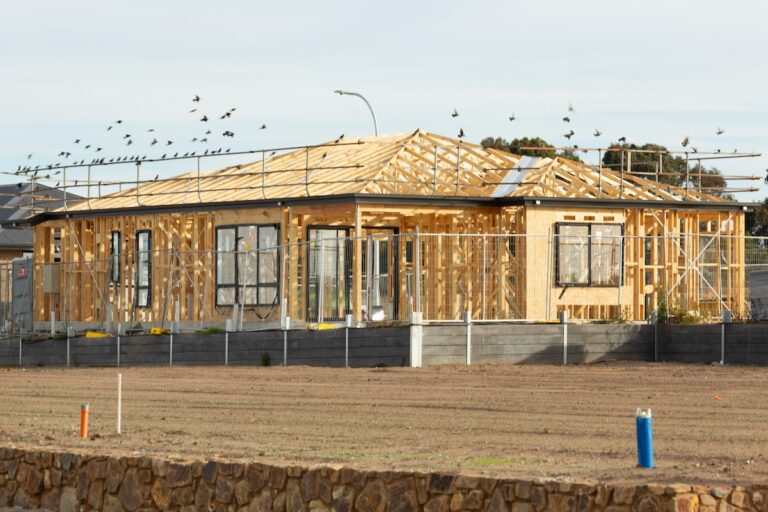
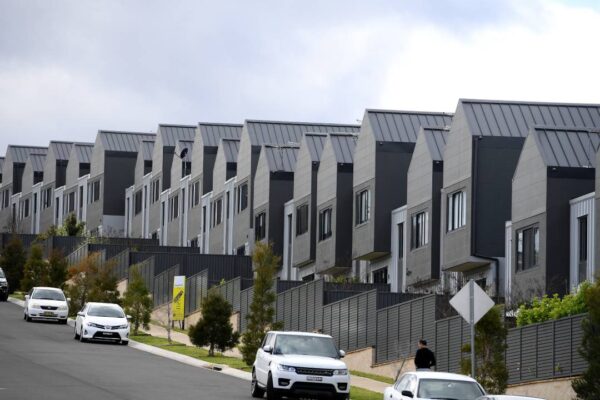
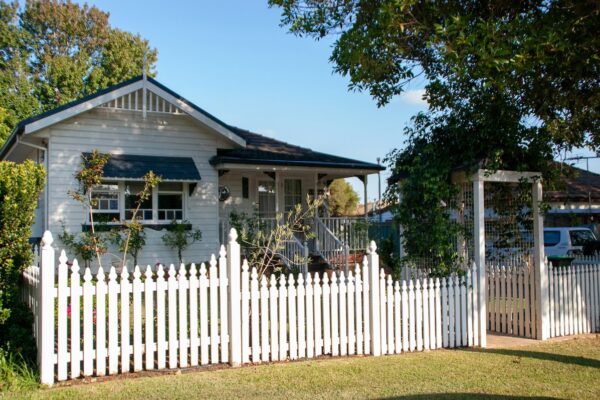
Jim Chalmers has bet the house, literally, on his Budget reshaping the property market without wrecking it for the millions of Australians who already own one.